
Introduction
This project was completed for a Data Science course at General Assembly in August 2018. The aim was to choose a project that could potentially be solved by data. IPython (Jupyter) notebooks were used to import and clean the data, with a lot of data parsing required for this project, and perform the modelling and visualisations. This document is not meant to be a formal academic report, rather just an informal presentation of the findings.
Problem Statement
Determine if there is a relationship between training factors, such as training volume and pace, and race pace and if there are ideal training factors, using GPS running data from a sample size of at least 20 runners who competed in the Albert Park 10km road race in 2018.
Hypothesis
Training too fast or too slow will result in a poorer race performance.
Methodology
- Collect data from runners who completed a specific race, the Albert Park 10km Road Race held on 22 July 2018. By choosing a specific race we eliminate differences between courses and weather conditions.
- Collect 12 weeks of training data for each runner leading up to the race. 12 weeks was decided on as a good period for training adaptation.
- A request was put out to runners who competed with instructions on how to export GPS running watch data to a csv file and a form to complete with supporting questions.
- 28 runners responded.
Sample population
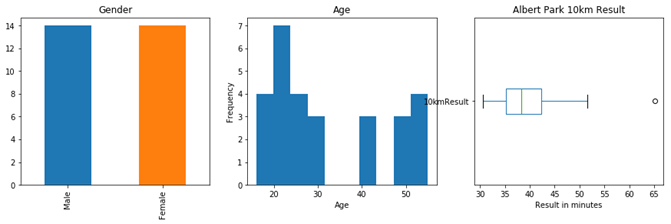
- Data collected for 28 runners. The race had a total of 810 finishers.
- Equal number of male and females responded.
- A range of age groups, however a gap in the 30-40 range.
- Average finish time of 39.8 minutes. Fastest 30.6 minutes, and last to finish was 65.1 minutes.
Age graded result
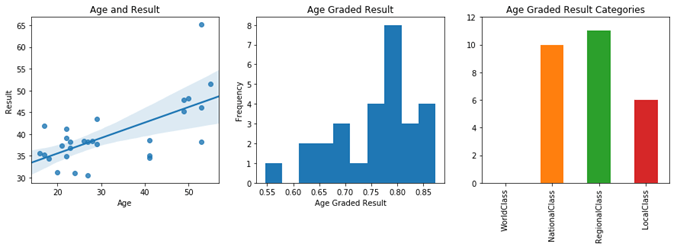
There is a correlation between Age and Result. Typically younger runners run faster times.
Age grading factors are maintained and applied to most running events. More information about age grading factors can be found at: http://www.runscore.com/Alan/AgeGrade.html. We will use age graded results for a fair comparison of how good the 10km result was for the age and gender of the runner.
The output of the age grading can be understood as:
| Age Grade | Category |
| Above 100% | Usually, at least, a record setting performance for that age and distance |
| 100% | Approximate world record level |
| Above 90% | World Class Level |
| Above 80% | National Class Level |
| Above 70% | Regional Class Level |
| Above 60% | Local Class Level |
The relationship between Age and Result is statistically significant. p < 0.005.
Training factors
The following training factors were included in the analysis:
| Weekly average | Per activity average |
| • Distance • Time • Elevation • Training stress score • Cross training time • Number of runs • Long run distance • Long run time • Long run intensity | • Distance • Calories • Time • Average heart rate • Maximum heart rate • Average run cadence • Maximum run cadence • Average pace • Best pace • Elevation • Stride length • Intensity |
Training factors were looked at over the 12 weeks leading up to the race.
Intensity is calculated by dividing average pace of the run by threshold pace. Threshold pace was calculated using Jack Daniel’s Running Formula based on 10km result. This gives us a figure of how intense each training run is in comparison to the 10km race result.
Training stress score extends on this by scoring the run based on the duration of the run and intensity. More information about the Intensity and Training Stress Score calculations used can be found here: https://www.trainingpeaks.com/blog/running-training-stress-score-rtss-explained/
Long runs were identified by taking the longest run per week for each runner from week 1-11. Race week was ignored with the assumption that most would not have completed a long run the week of the race.
Correlation heatmap
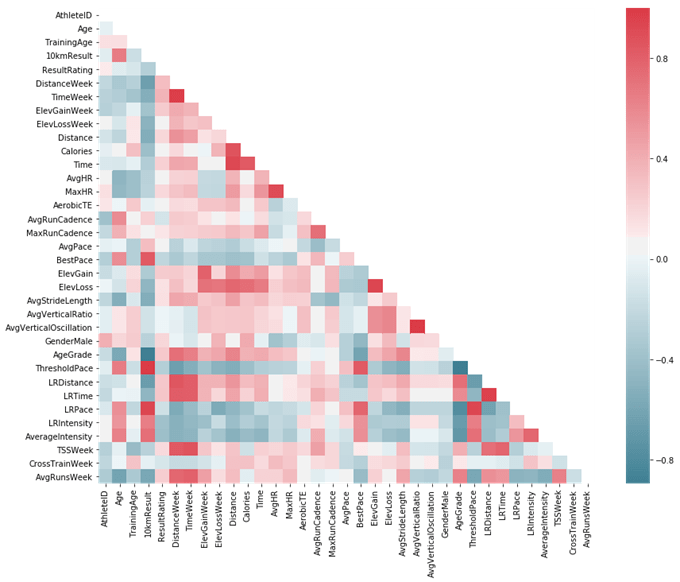
A matrix was produced of all variables returning the strength of every correlation. From this matrix the following heatmap was generated. The darker the colour the stronger the linear relationship, 1 is equal to a perfect linear relationship, 0 is no relationship, and -1 is a perfect negative linear correlation. Looking at the heatmap the darker the colour the stronger the linear correlation.
Top factors correlated with Age Graded Result
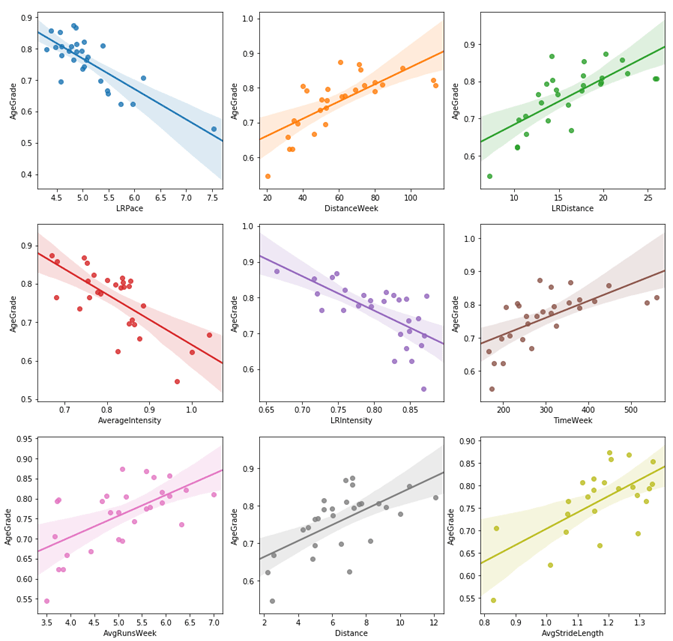
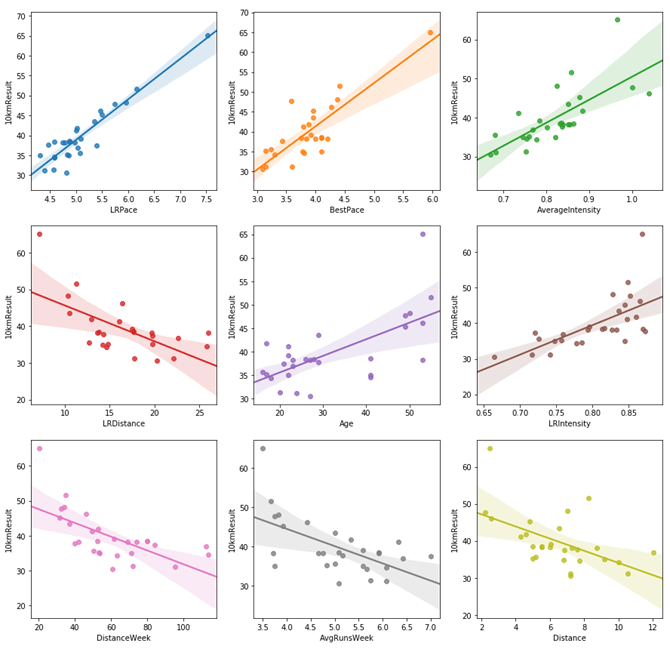
A correlation matrix was used to identify which training factors correlated with age graded result. Themes here include factors relating to the long run, amount of running and intensity. Below are the top 9 factors graphed with a linear regression line.
Top factors correlated with 10km time
When we look at factors correlated directly with 10km result we see long run pace and best pace come out on top. Essentially faster runners are naturally going to be training faster. Interestingly intensity is shown as a major factor again. Faster runners tend to train at a lower intensity overall and on their long run. My thoughts are that they are also training at a higher volume per week with more easy runs to increase the running volume.
Identifying which factor is most important for a good age graded result
With a number of correlations identified I was curious to understand which factor was most important for a good age graded result.
‘National Class’ age grade was as our definition of a good result, which is approximately one third of our runners.
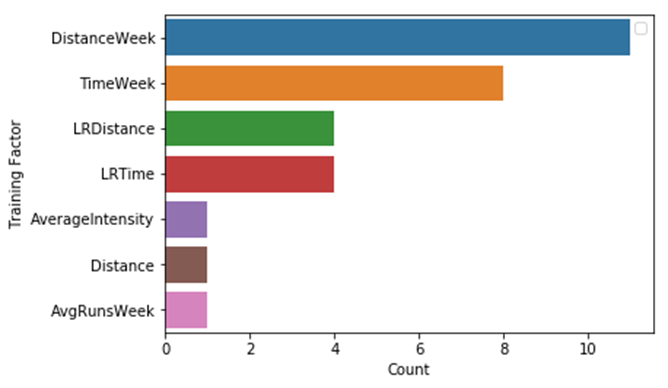
A random forest model (multiple decision trees) was used to identify the most important factors. Unfortunately I kept getting different results each time the model was ran. More data is needed to build an accurate model.
However, what could be done was re-run the model over and over again and take the most important factor each time. The model was ran 30 times for what is considered a reasonable sample size. Distance and time per week (which are both correlated with each other) came out on top.
However it is important to note that more data is needed to get a reliable result.
Distance per week
With distance per week identified as potentially the most important factor, I wanted to delve further into building a linear model.
Unfortunately adding additional factors to the model wasn’t making it any more accurate.
There is a lot of multicollinearity in the training factors which made it difficult to model with multiple factors. Runners who train at higher distance’s per week, also train at a lower intensity (long run and average across all runs), run more days per week, more distance per run, have a longer long run and have a longer stride length. All of these factors correlate with a good race result.
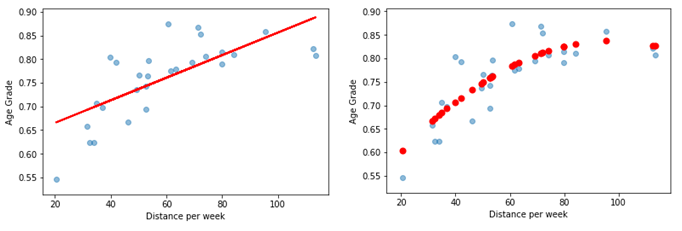
We were also able to fit a linear model to Distance per week and Age Grade with fairly good accuracy, our model is able to explain 65% of the variation in Age Graded Result on distance per week alone.It was found a curved line (quadratic) modelled the data better. This showed the Age Graded performance level start to taper off from a training volume of 80km per week and higher. There are many possible explanations for this, 80km per week could be the sweet spot for a 10km race, runners training at a higher volume may be focussed on longer distance events, or we may just not have enough data (likely).
Stride length and cadence
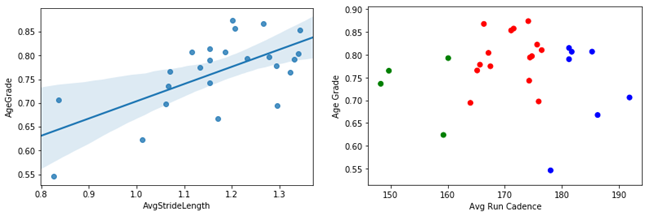
There was not a strong linear relationship for cadence. However there is potentially an ideal middle range which can be shown using K means clustering. More data would be required to be confident.
Findings
- Distance/time running per week was identified as potentially the most important training factor for a good 10km result. Generally the more you run the better the result.
- This also applies to average distance and duration of each run and the weekly long run.
- Faster long run pace and best pace correlate with a better result. However a lower average training intensity and long run intensity in relation to 10km race pace also correlates with a better result.
- A longer stride length correlates with a better result and there may be a middle ground for average cadence around 170 steps per minute.
Limitations and potential further steps
- More data is required!
- The random forest model was not accurate and could only provide a rough estimate. The quadratic linear model for distance per week may be over fitting to our data, i.e. I wouldn’t be confident in saying running 100km per week is no better than running 80km per week, even though the model shows this. Too few data points.
- Training sessions were not able to be analysed in any detail, only the summary data of each run
- Comparing other race distances – what would we find for shorter or long distance events?
This article was originally posted on my personal blog Ben Runs Melbourne: https://www.benrunsmelbourne.com/2018/08/analysis-of-running-training-and-race-result-albert-park-10km/
About the author : Ben Mudie

Ben is the head coach at Beam Running. Ben first took up running in 2013 and it changed his life. He now wants to share that with others.
Related Posts


Thanks Ben, was honestly everything I thought it would be. Was a lot of mental game from early on. You’re advice really helped. I really stuck to the plan and the last 10km I just took it 1km at a time and knew I had enough left in the tank to keep going. It was such an overwhelming experience something I’ve never had felt in my life. Again thank you for everything, I know in myself I would never have achieved what I did without your help and training.

Thanks to an amazing running program by my coach Ben Mudie!!!

I WOULD LIKE TO THANK @ben_mudie for helping me with my training plan for @austrunningfest half mara… I did it! PB!

Having my runs set out each week is probably my favourite thing. It’s very nice not having to think about it, allows me to laser focus each session and get the most out of it